|
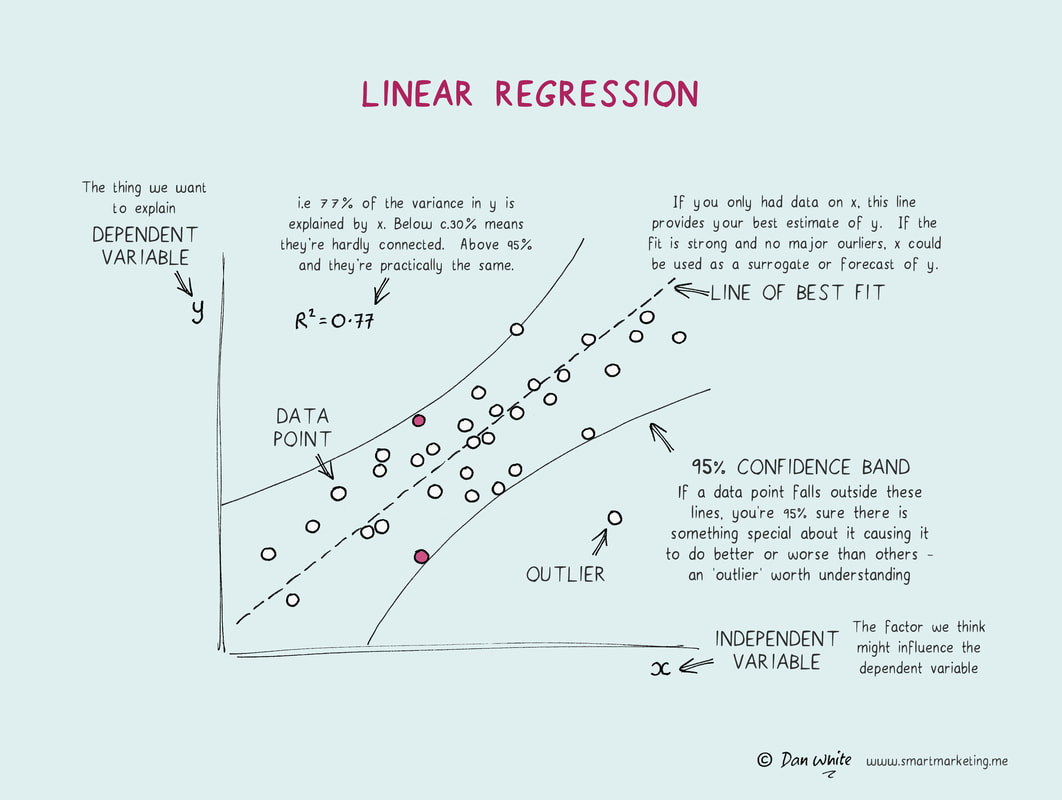
Linear regression is used to see how well an outcome (’dependent’) variable can be predicted by another (’independent’) variable. Even if there is a high correlation overall, it’s important to look at the graph to see how far off the mark a prediction can be before using it to guide decisions (see red dots). What to learn more? Try asking Virtual Dan White. |
- Home
- Books
-
Illustrations
- Marketing
- Brand Development
- Brand Experience
- Innovation
- Communications Strategy
- Media Characteristics
- Creative Content
- Pricing & Sales Promotion
- Measurement
- Data and Analysis
- Brand Review & Planning
- Brand Extension
- Mental Processes
- Business
- Business Story Telling
- Case Examples
- Wellbeing
- People Skills
- Life Hacks
- Articles
- Media
- Services
- Merchandise
- Contact

